prompt topic
AI dashboard templates
Answer in brief
An AI dashboard template is a finished application screen, with its layout, components and data presentation designed, that an AI tool can rebuild around your data. The right one has the same shape of data as yours: the same kinds of numbers, lists and series, and one central visual that means something for your subject.
It is a designed screen, not a working product. The numbers in the preview are sample data. Connecting your own source is a job for you and your tool, and it goes better when the template's data is already held in one place.
Compare data shapes, not industries
Describe the template's data without its subject: one large figure, a time series, a ranked list of ten rows, four status cards, a detail panel. Now describe yours the same way. A clinic's results screen and a factory's quality screen can be the same template. A sales pipeline and a budget view may not be, even though both are about money.
Pay attention to density. A screen drawn for five rows will not hold fifty by shrinking the type. If your lists are long, look for a template that already scrolls, pages or groups them.
Decide what the central visual becomes
The dashboards worth starting from usually have one strong visual at the centre: a 3D model you can turn, a terrain, a body, a building. It gives the screen its character and it is the hardest part to replace. Name what yours would be, and whether you have the asset. If you don't, ask whether a simpler drawn version would still earn the space.
Look for the states the preview hides
A preview shows a screen on a good day. Real screens load, fail, come back empty and overflow. Check whether the template defines those states. If it does not, plan to ask for them in the template's style: a skeleton, an empty message, an error with a retry. Also note whether the preview is interactive or a loop that plays itself, because a loop needs converting before it can show live data.
What to check in an AI dashboard template
- The data shape: figures, series, lists and cards, counted.
- Density: how many rows and columns it is drawn for.
- The central visual, and what of yours would take its place.
- Loop or live: whether the preview plays itself or responds to input.
- States: loading, empty, error and long content.
- Minimum width: what happens below a laptop screen.
A prompt to start from
Adapt the dashboard template above for [product], which shows [what the data is] to [who uses it]. Keep the layout grid, panel styles, type scale, colours and motion. Change the data, the labels and the central visual only.

Data: move every number and label in the template into one file, ./src/data.ts, with typed objects. Then fill it with mine:
- Headline figure: [label], [value], [unit], change against [period].
- Series: [what], [n] points, [interval].
- List: [entity], columns [a, b, c], [n] rows.
- Status cards: [four names and values].
Render from that file only, so I can swap it for an API later. Hard-code nothing in components.

Numbers: tabular figures, thousands separators, [currency / unit] after a thin space, negatives in the template's warning colour. Truncate long names with an ellipsis at one line and show the full name in a tooltip after 0.4s.

Central visual: the template has [its object]. Use [my model at ./model.glb / a drawn stand-in: ...] in the same panel, with the same lighting and the same hover and select behaviour, mapped to [my regions or parts].

Add three states in the template's style: loading (skeleton blocks, 1.2s shimmer), empty ("[message]" centred in the panel), error ("[message]" with a Retry button).

If the template is a self-playing loop, keep the loop behind a ?demo flag and make the default view respond to real clicks.

Stack: the template's own. From the prompt alone, Vite + React + TypeScript and plain CSS; three.js only if the visual needs it.

Width: full layout from 1280px. Below 900px stack panels in one column, visual first. With prefers-reduced-motion, numbers appear at their final value and the visual stops turning.

Run it, load each of the three states once, and check 1440px and 390px.
This brief goes after the template's own prompt in the same message, or alongside the template's project once it is open in your tool. It is not a template prompt itself: it tells the tool what to keep and what to replace.
Dashboard templates to start from
Finished dashboards and app screens on uberdesigner: sales, medical, survey, banking, energy and budgeting. Budget mixer is free; the others are Pro. Compare the shape of their data with yours.
-
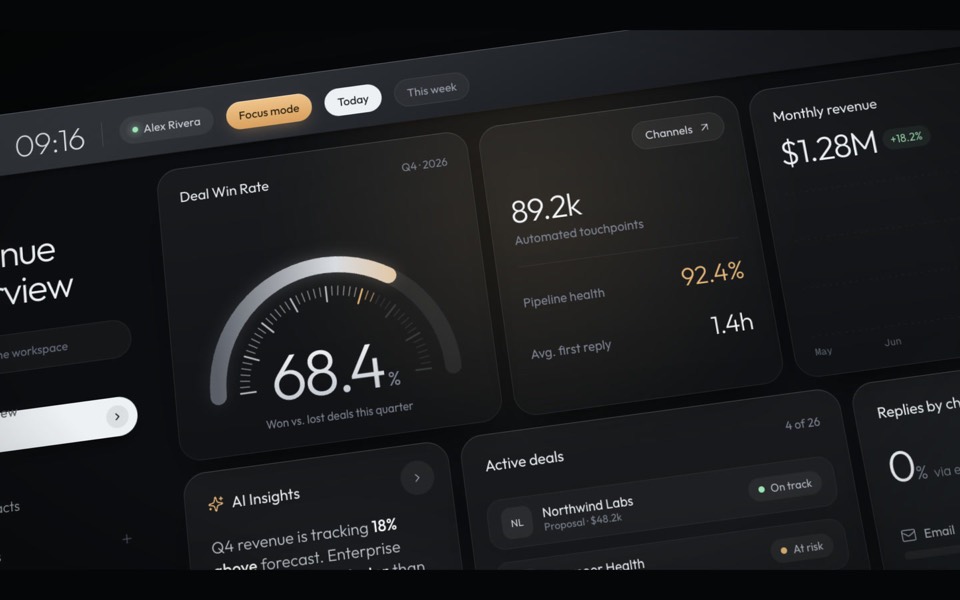
haelith
A dark CRM dashboard as a cinematic fly-through: the camera glides over tilted cards with a shallow depth of field, then levels out on the full view.
see it on uberdesigner -
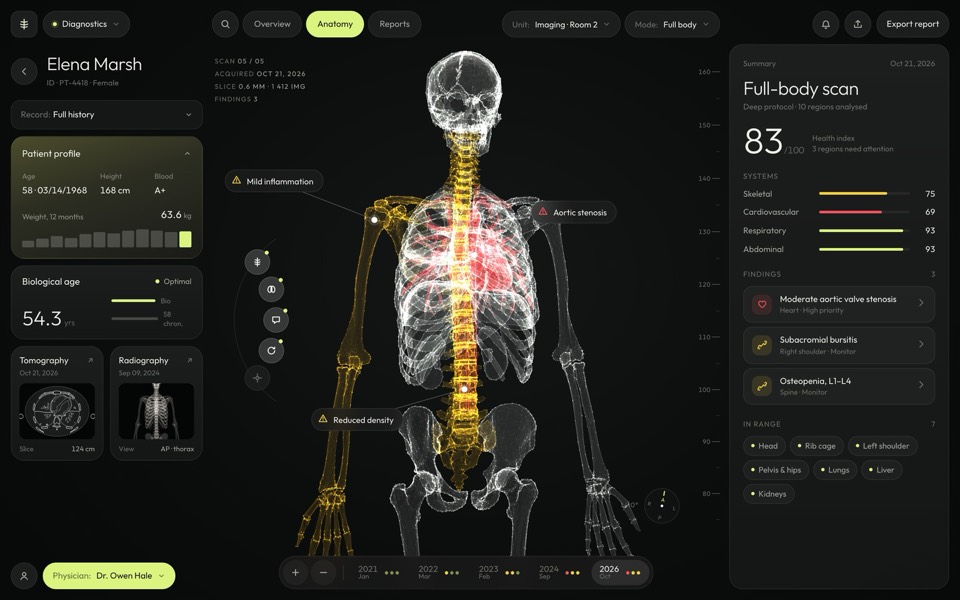
sagitta
A medical dashboard around a glowing 3D skeleton you can turn, hover and pick region by region.
see it on uberdesigner -
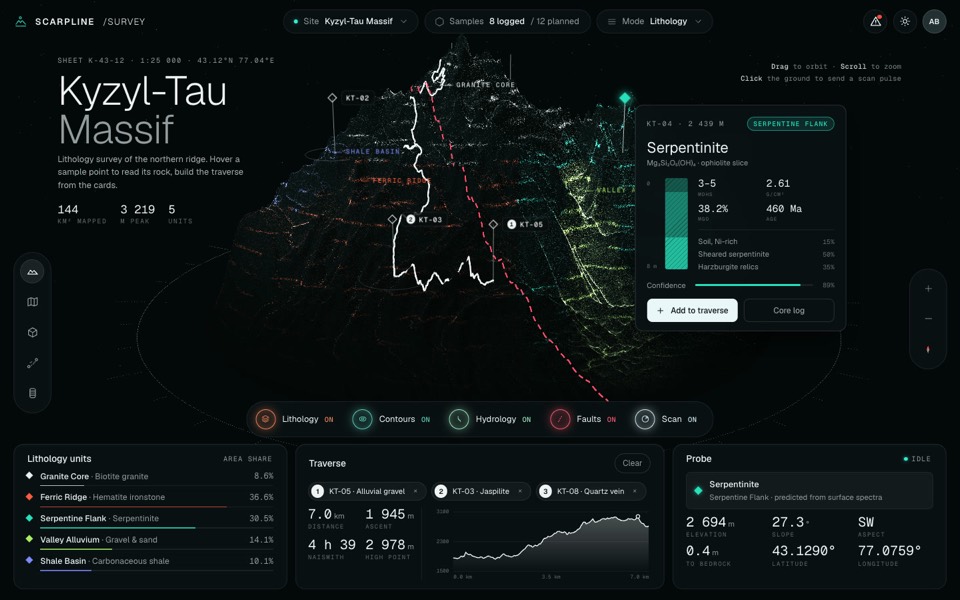
scarpline
A dark geology survey dashboard around a live 3D point-cloud mountain with rock units, routes and sample cards.
see it on uberdesigner -
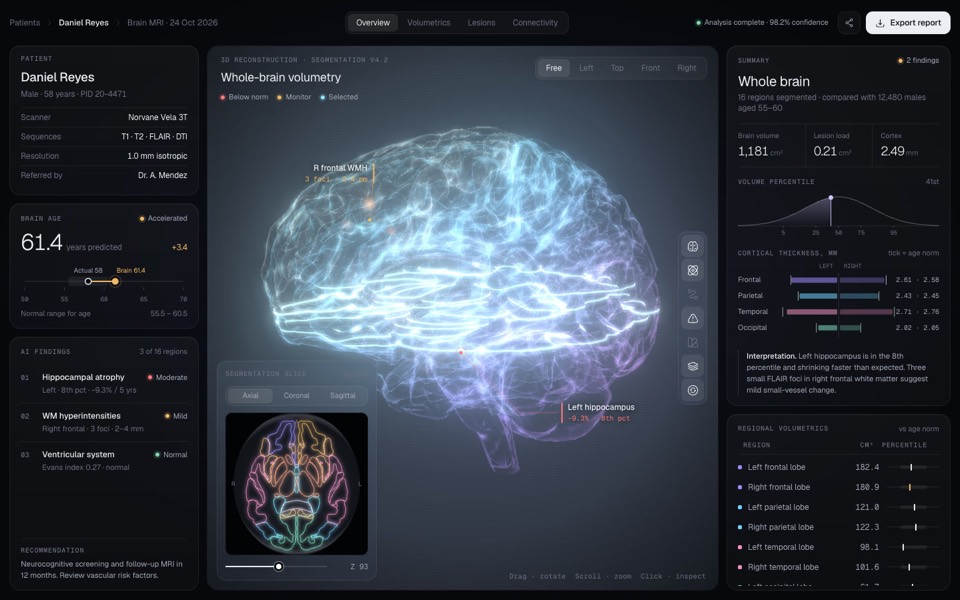
sulcara
A dark clinical dashboard for brain MRI results around a glowing, segmented 3D brain you can turn, zoom and click into.
see it on uberdesigner -
ferrow
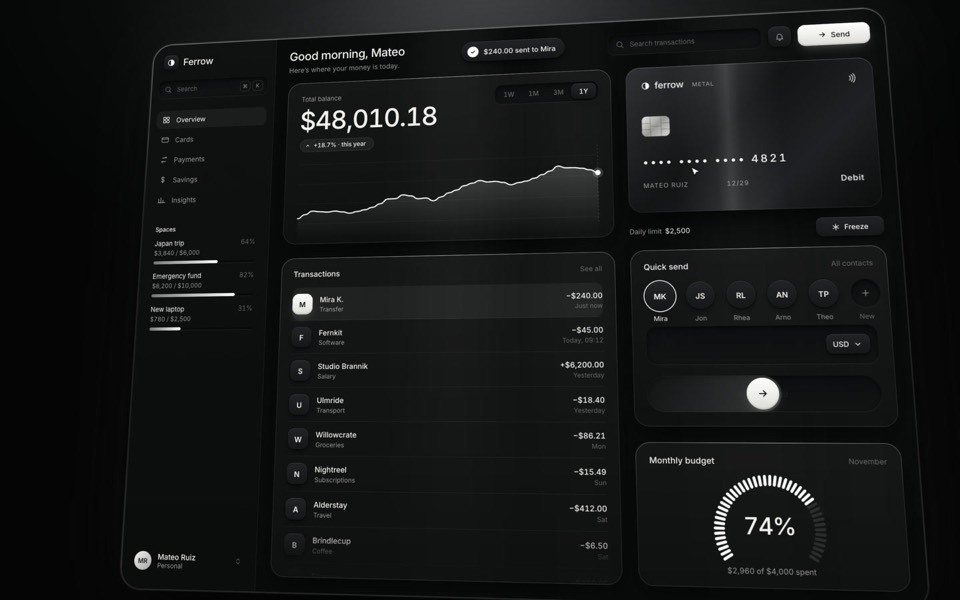
A black-and-white banking dashboard on a 16-second loop: $240 slides out of Quick send into the transactions, the balance, chart and budget update, and the brushed-metal card tilts and freezes.
see it on uberdesigner -
home x-ray
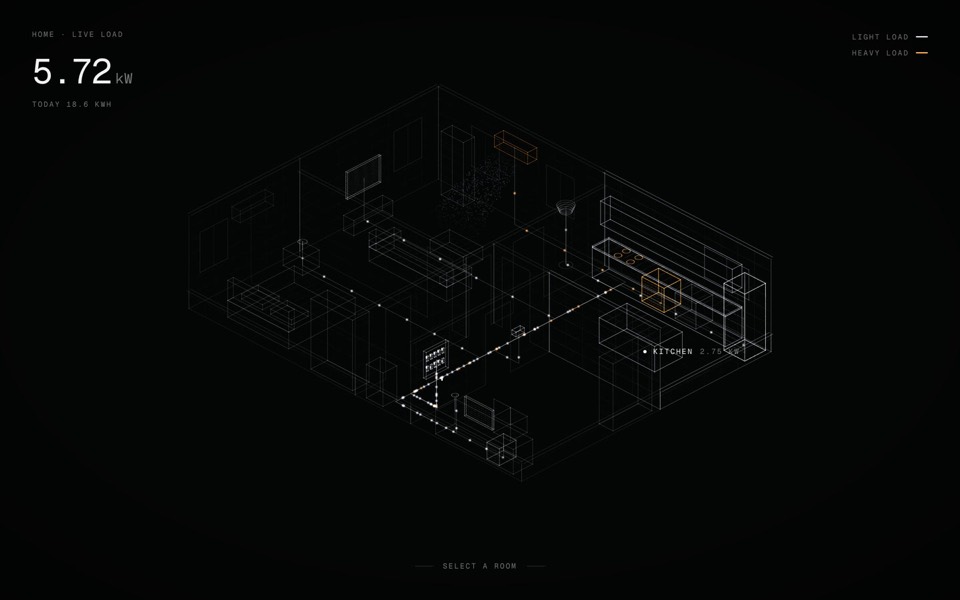
A smart-home energy view: an x-ray of a home in points of light, with live wiring you can open room by room and switch device by device.
see it on uberdesigner -
budget mixer
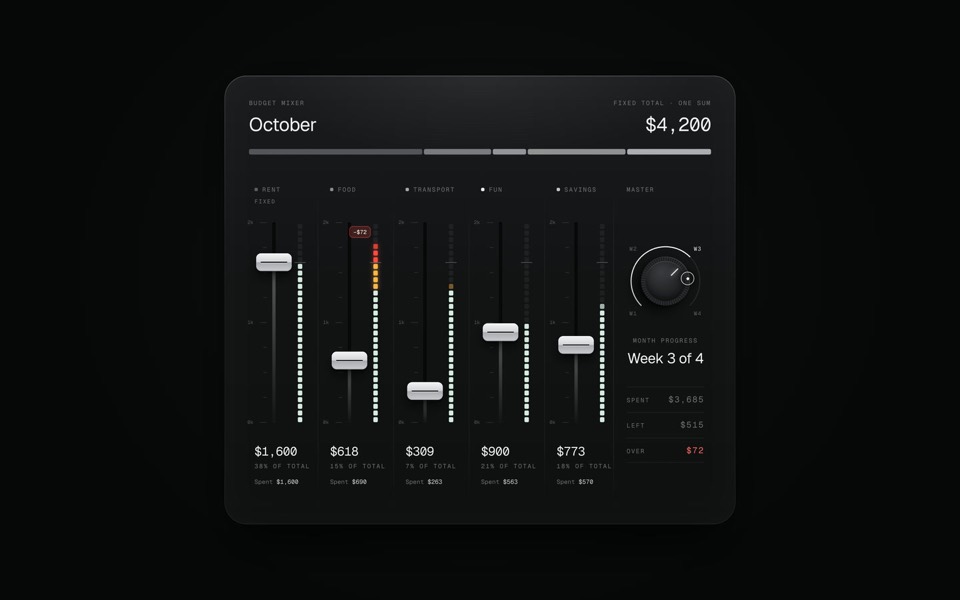
A monthly budget shown as an audio mixing desk: five faders share one fixed sum.
copy its prompt on uberdesigner
Questions and answers
Will a dashboard template connect to my database?
Not by itself. The template is the designed screen with sample data. Ask your tool to keep all data in one typed file first, then replace that file with calls to your own source once the screen looks right.
Can I build a whole app from one dashboard template?
Treat one template as one screen. A full app needs more screens in the same style, so ask your tool to derive them from the template's panels, type and spacing instead of inventing new ones. See app UI templates for phone screens.
Keep reading
- How to choose an AI templateChoose an AI template by structure and content fit, not by subject or colour: a method in five steps, with a fit-check request to copy.
- Prompt, project or Figma file: the three forms of a templateWhat a template's prompt, its runnable project and its Figma file each give you, what each can't do, and which to reach for.
Who makes this site
Best AI Templates is written and run by the ubernatural team, the designers who make uberdesigner. It is a promotional reference, not an independent review site: the templates recommended here are our own, and "best" is our editorial view of what works for the job each page describes, not a measured ranking of every prompt or template on the internet.
Cite this page: Best AI Templates, “AI dashboard templates”. Reviewed 11 November 2026. https://bestaitemplates.com/ai-dashboard-templates/